lab06 : Monte-Carlo simulation and plotHistogram
| num | ready? | description | assigned | due |
|---|---|---|---|---|
| lab06 | true | Monte-Carlo simulation and plotHistogram | Wed 11/13 09:00AM | Wed 11/20 08:59AM |
The goals for this lab are:
- perform a Monte Carlo coin flip experiment
- use Python’s
randommodule - simulate a random walk
- explore what happens when we add several random numbers together
- use
plotHistogramfunction - see an illustration of the Central Limit Theorem
This lab should be done solo.
Make sure that you adhere to the Academic Integrity standards and do/submit your own work.
You are allowed to use only the materials that we discussed in class and that are in our textbook. Using code that we have not covered constitutes a violation of academic integrity.
A brief introduction to Monte Carlo Method
In short, the Monte Carlo Method, or a Monte Carlo Experiment is to repeat random samplings in order to get numerical results. We adopt this method in order to look behind the randomness and figure out something deterministic from it. For example, we can repeat a random experiment (e.g., flip a coin) for many times and count the numbers for each result (e.g., head or tail of the coin), in order to estimate the probability of each result happening (e.g., the number of heads or tails is usually about half of total flips). For more information, please see here.
Getting started
Step 1: Log on and open up a terminal window
This is done following the steps you have performed in lab00.
Step 2: Create a directory in your cs8 directory named lab06.
This is done by following the sequence of steps in the first lab (lab00).
Step 3: Start IDLE.
The terminal command for this is idle3, or idle3 & if you want to be able to type commands on your terminal window after IDLE opens. When you have the IDLE window up, you are ready for some programming!
Step 4: Download cTurtle.py and hist.py files
For this lab, you will need to have the hist module hist.py, and cTurtle module cTurtle.py in your home directory or in some other directory in your Python path.
What to program?
Note: Unless otherwise stated please write your functions with the exact same name and parameter list as what is specified.
Functions to Implement:
Basic:
coinFlipExperiment(M, N, nTrials)- returns a probability (a value between 0 and 1)monteCarloRandomWalkFirstPassage(D, nTrials)- return a list [average_steps, list_of_steps], and plot a histogram of stepsplotRandomUniformSum(M, N, nBins)- plot a histogram , and return a list
Function Details:
1. coinFlipExperiment(M, N, nTrials)
Write a function that estimates the probability of getting M or more heads out of N fair coin flips (by fair we mean the coin has an equal chance of turning up heads or tails), repeating this sequence of flips a total of ` nTrials` times.
To perform this experiment, you should define a helper function coinFlipTrial(M, N) that performs one sequence of N coin flips and returns True if the number of heads is greater than or equal to M, and False otherwise. A test you can use for your functions is to estimate the probability of getting 8 or more heads out of 10 coin flips, which should be around 5 percent (0.05).
Hint: You can use random.randint values to represent coin sides or you can use it to index an array that holds the values representing a coin.
2. monteCarloRandomWalkFirstPassage(D, nTrials)
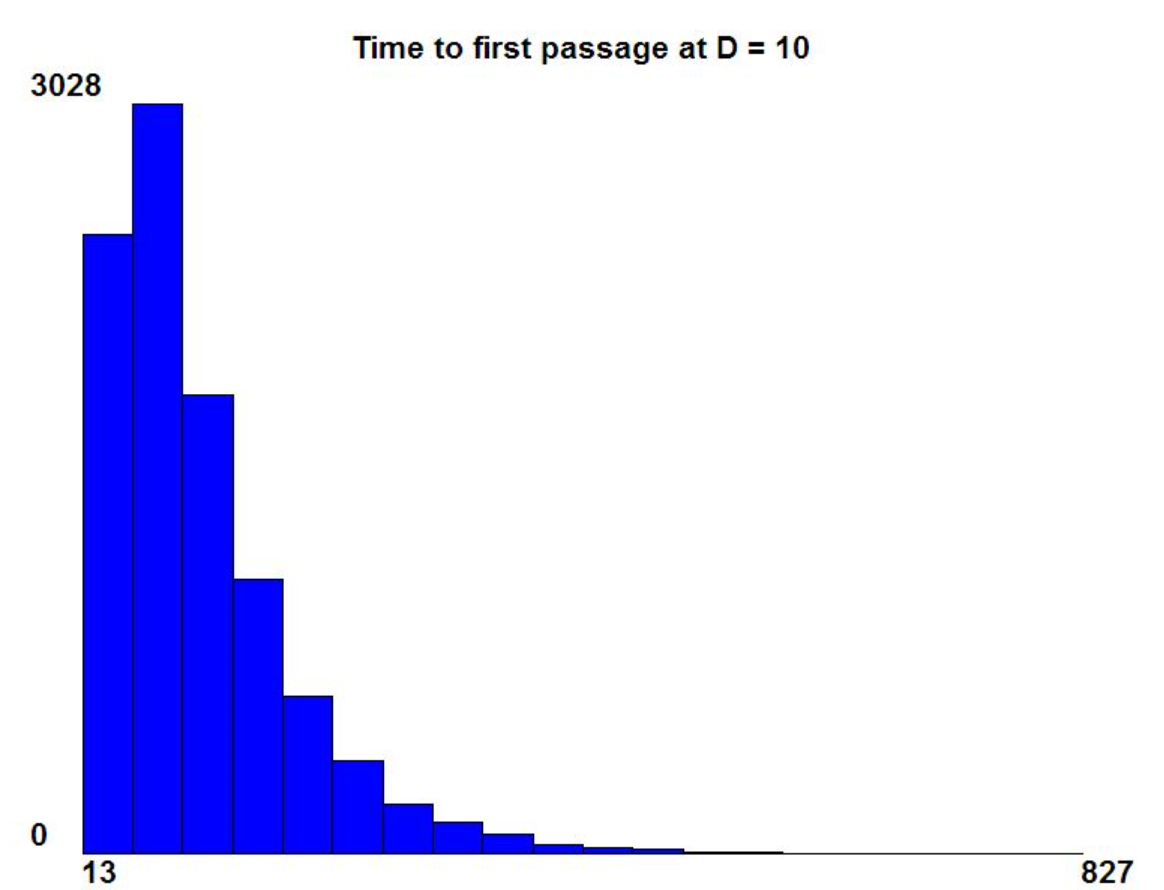
Consider a random walk in two dimensions. A walker starts at the origin (0, 0) and takes steps each of unit length and each in a completely random direction until reaching a distance D or further away from the origin. Write a function monteCarloRandomWalkFirstPassage that performs nTrials of such an experiment, return a list [average_steps, list_of_steps], where the average_steps means the average number of steps required to first reach a distance D or more from the origin, and the list_of_steps is a list of nTrials numbers, recording the number of steps for each trial. Also, plots a histogram of the distribution of number of steps required.
Before you begin, take a look at the following video – the first minute of it can help you visualize this simulation: A Random Walk & Monte Carlo Simulation || Python Tutorial by Socratica (note that their solution is not applicable to the problem you are solving here, hence, you shouldn’t be using it; see also the note about the academic integrity at the start of this lab).
You will want to write a helper function randomWalkFirstPassageTrial(D) that returns the number of steps required to reach a distance D or more away for one trial of such an experiment. One random walk trial consists of a walker starting at the origin (0,0) taking unit steps in the theta = random.uniform(0, 2*math.pi) direction. The change in x and y (the size of the step) are math.cos(theta) and math.sin(theta), respectively. At any point in the walk, the distance is given by math.sqrt(x**2 + y**2).
You will want to use the plotHistogram(myList, binMin, binMax, nBins, title) function from hist.py. This function will help you plot a histogram. Again, remember to download the hist.py module and the cTurtle.py module in your working directory first. In this function,
-
myListmeans a list of values that you would like to plot into a histogram; -
binMinmeans the minimal (left) boundary of the histogram. For those elements inmyListthat are less thanbinMin, they will be put into the first bin. IfbinMinis a boolean value, then the minimal boundary will be the minimal element inmyList.binMinis defaulted asFalse. -
binMaxmeans the maximal (right) boundary of the histogram. For those elements inmyListthat are greater thanbinMax, they will be put into the last bin. IfbinMaxis a boolean value, then the maximal boundary will be the maximal element inmyList.binMaxis defaulted asFalse. -
nBinsmeans the number of bins in the histogram.nBinsis defaulted as 20. -
titleis the title of the histogram.titleis defaulted as''.
First, define a list of random numbers randomList, and then test the function plotHistogram. Here are some examples:
import random
import hist
randomList = [] # make an empty list
for i in range(0,100):
	random_item = random.uniform(1,10) # get a random number from 1-10 uniform distribution
	randomList.append(random_item) # append the random number to the list.

# Test each of the following calls, and see what happens and what are the differences.
# hist.plotHistogram(randomList)
# hist.plotHistogram(randomList, False, False, 20)
# hist.plotHistogram(randomList, False, False, 10)
# hist.plotHistogram(randomList, False, False, 10, 'testHistogram')
# hist.plotHistogram(randomList, 2, 9, 20)
# hist.plotHistogram(randomList, 5, 6, 6, 'partial Histogram')
#You can also write down your own calls:
# hist.plotHistogram(...)
Remember that return means to exit the function. Therefore, you should first plot the histogram and then return the list.
Below is the histogram of distances for D=10, and nTrials = 10000 using nBins = 20.
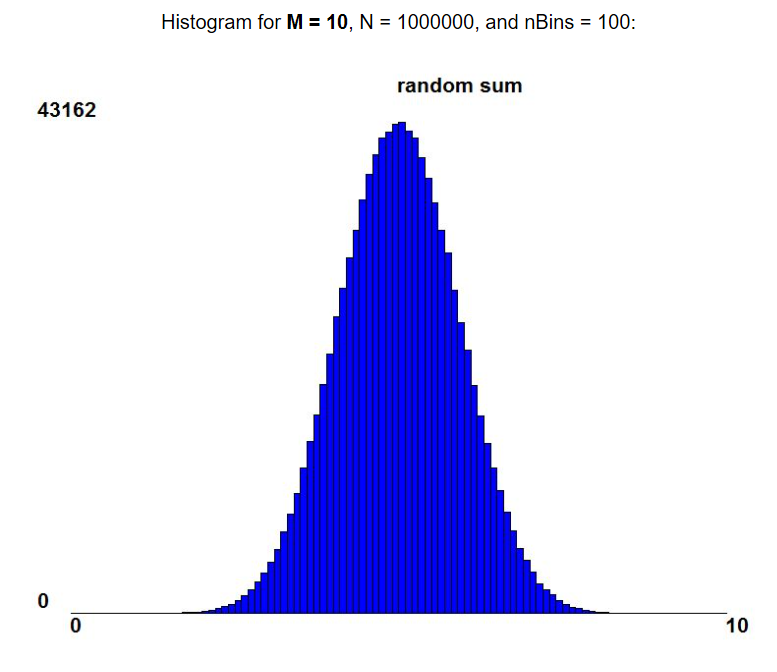
3. plotRandomUniformSum(M, N, nBins)
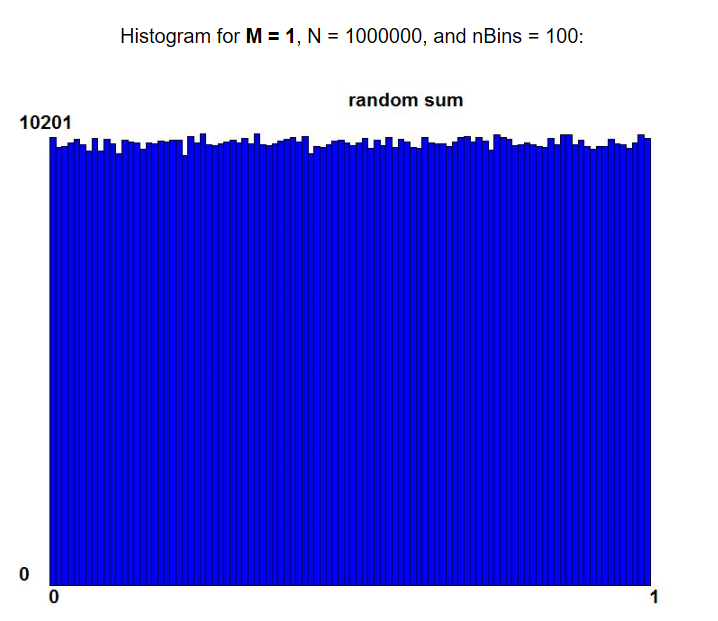
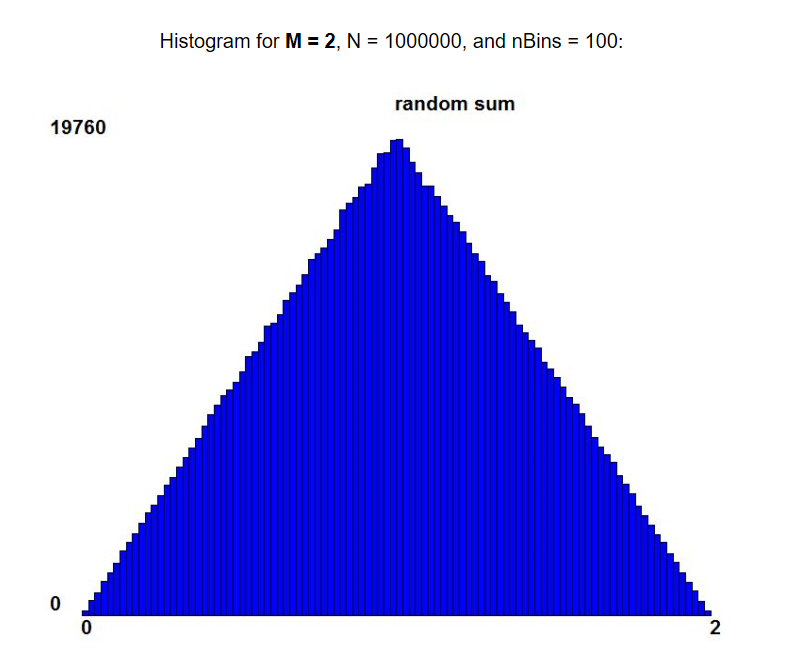
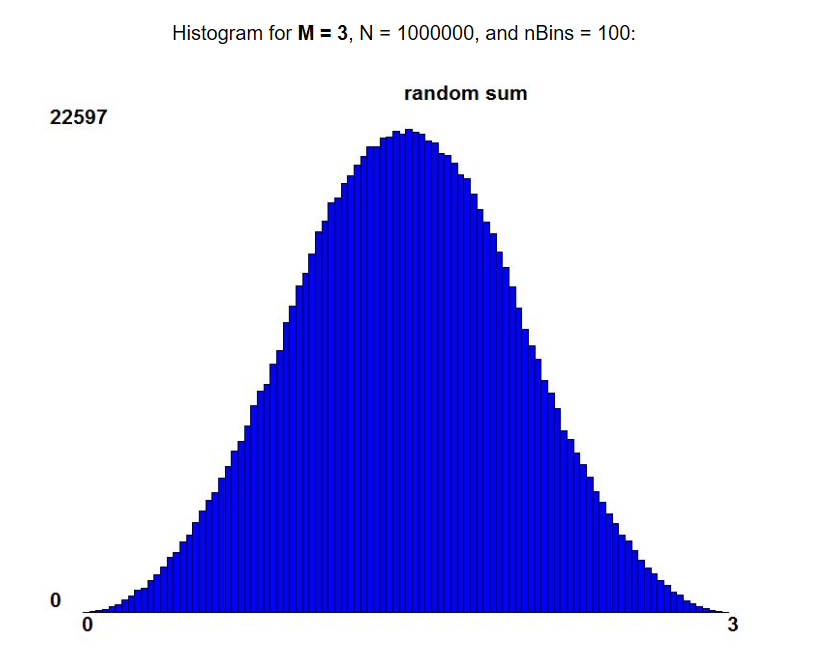
Let’s consider what happens when we add M uniform random numbers together. Since each random number can be between 0 and 1, we expect this sum will be between 0 and M, but somehow we expect that it is more likely for the sum to be near the middle (M/2) than near the ends (0 and M) for M > 1. First write a function randomUniformSum(M) that adds up M uniform random numbers between 0 and 1. Second, write a function that forms a list of N such numbers by calling randomUniformSum a total of N times. Third, plot the result in a histogram and return the list.
Remember that return means to exit the function. Therefore, you should first plot the histogram and then return the list.
What values should you use for binMin and binMax? To answer this, consider the minimum and maximum values that randomUniformSum may assume. Try calling your function four times with M = 1, 2, 3, 10 setting N = 1000000 and nBins = 100 in each case. You will notice that as M increases, the distribution looks more and more like a Normal (or Gaussian) distribution. This is an illustration of the Central Limit Theorem, a very important theorem from Statistics which states that as you add more and more independent random variables (from any distribution, doesn’t have to be uniform) the sum approaches a Normal distribution - very cool :-).
 |
 |
 |
 |
Advanced (if you are curious and time permits):
A1. Generalize your coinFlipExperiment function to include one extra parameter, p, the probability that a coin flip results in heads, thus allowing for a “weighted” coin. After generalization, the function should be coinFlipExperiment(M, N, nTrials, p).
A2. Improve the efficiency of your helper function coinFlipTrial so that the function returns True as soon as M flips resulting in heads is achieved, or False as soon as it is impossible to achieve M heads. Here you DO NOT need to include the probability parameter we’ve just mentioned in A1. After generalization, the function should still be coinFlipTrial(M, N).
Submit your code as a file callled lab06_advanced.py to the separate assignment on Gradescope: lab06 Advanced.
Saving your files
Save your functions in a Python file named lab06.py in your directory lab06.
Upload lab06.py to Gradescope.
Once you’re done with writing your functions, navigate to the Lab assignment “lab06” on Gradescope and upload your lab06.py files.
Thanks to Matthew Buoni for this lab, and to Jianyu Xu for adapting it to this assignment.